Milk from cattle and other domestic livestock has been an important food source for humans for thousands of years. The oldest evidence dates back to at least 6000 years ago in Africa, even before humans had evolved the gene to produce milk digesting enzymes past infancy [1]. Although per capita consumption of fluid cow’s milk has been falling for over 70 years in the USA [2], milk is among CPI basket of goods and services [3] and it could be a last resort alternative to baby formula for babies older than 6 months, in times of supply shortages and product quality issues [4, 5]
The Code of Federal Regulation defines dairy milk as “lacteal secretion, practically free from colostrum, obtained by the complete milking of one or more healthy cows” and should contain less than 3.25% milkfat [6]. There are many varieties of milk available in grocery stores nowadays. The primary types of milk available are whole, reduced/low-fat, and fat-free milk.
Mojonnier methods and Gerber methods are typically used to determine the milkfat contents. These methods involve sample preparation and chemical testing, which is very cumbersome. Raman spectroscopy provides clean, cost-effective, and real-time quality testing of different types of milk.
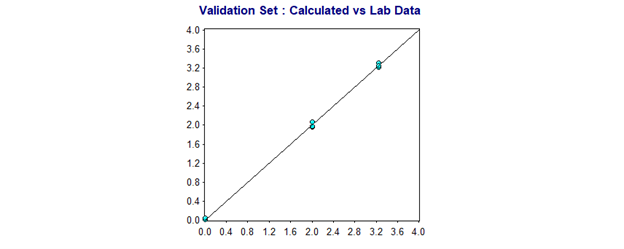
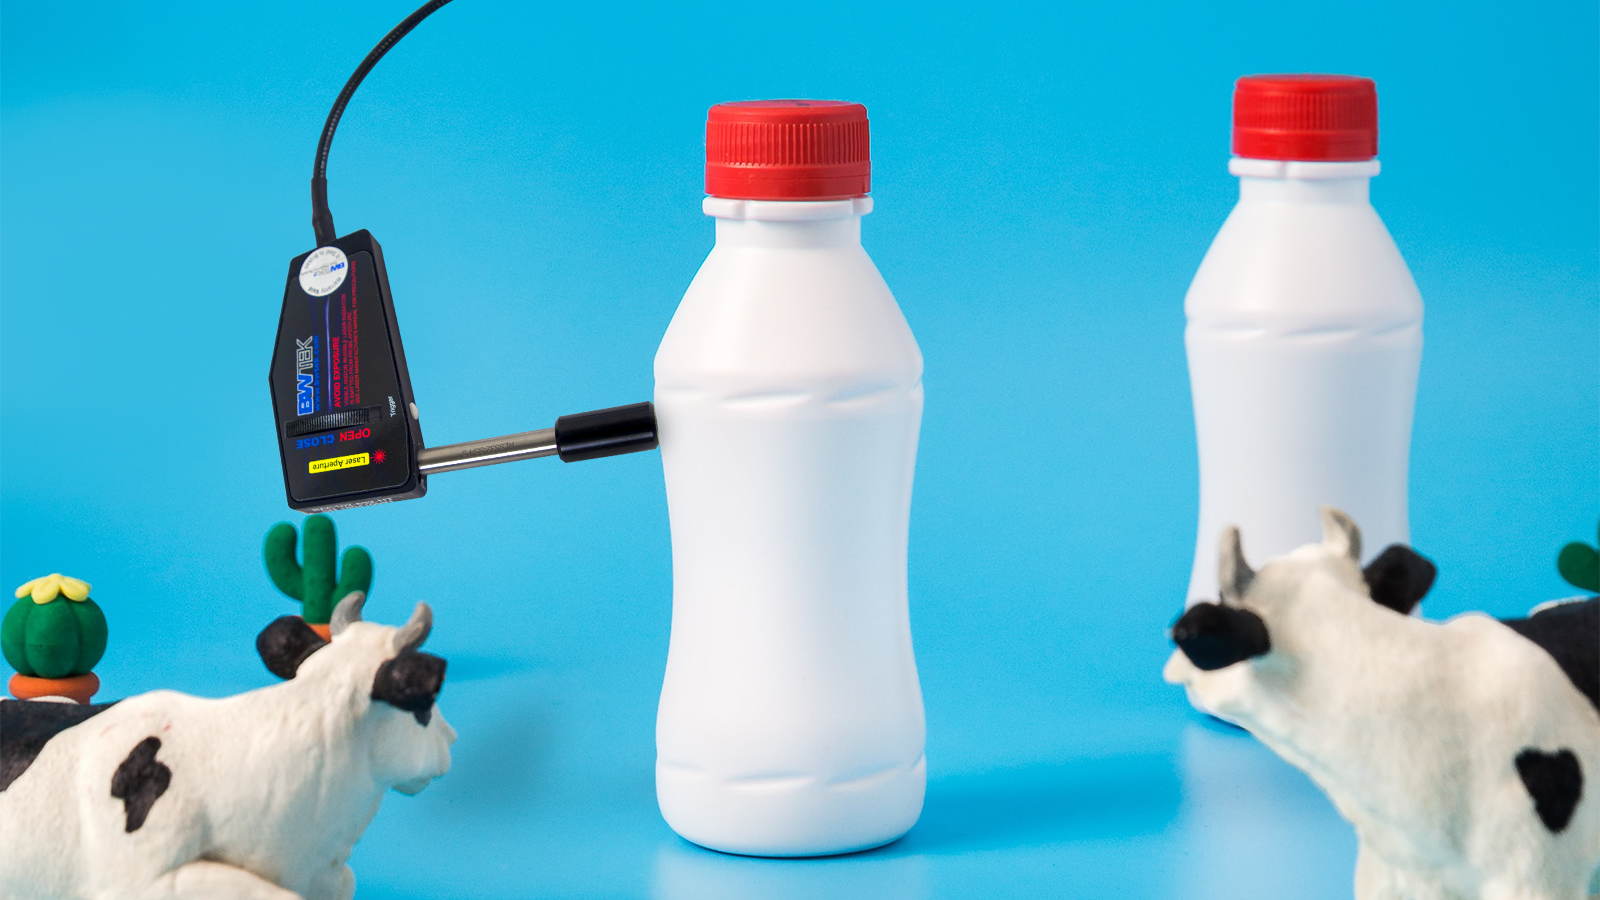
Figure 1. Raman profile of whole milk (black), 2% milk (grey) and 0% milk (red) [7, 8]Figure 1 shows Raman spectra of whole milk (3.25%), reduced-fat (2%), and nonfat milk (0%) taken using an i-Raman Plus 785nm instrument with a BAC150B Raman probe holder. The Raman spectrum of nonfat milk was different from whole milk and reduced-fat milk, whereas those for whole milk are comparable to reduced-fat milk. In addition, the Raman bands related to the fatty acids of nonfat milk were unique, suggesting that the fat content is different. Quantitative analysis of the milkfat content was performed using VISION software. Figure 2 shows the validation model build for Raman bands between 1500 – 1800 cm-1, targeting milkfat. The R2 of the calibration and validation models was 0.99, and SEP of the validation set was 0.043.
 Figure 2. Validation set for Raman bands between 1500 – 1800 cm-1. Blue plots are validation samples.
For more information about B&W Tek’s Raman systems, visit us here!
[1] Curry A., 2021. doi: 10.1126/science.abg7697 [2] Stewart H., et al., 2021. doi: 10.22004/ag.econ.316500 [3] CPI Home : U.S. Bureau of Labor Statistics (bls.gov) [4] Martichoux A., 2022. Baby formula alternatives: Can you use cow’s milk, oat, soy or almond? www.news10.com [5] USFDA, 2022. FDA Investigation of Cronobacter Infections: Powdered Infant Formula. www.fda.gov [6] Code of Federal Regulations, https://www.ecfr.gov/current/title-21/chapter-I/subchapter-B/part-131 [7] Vaskova H., et al., 2016. Int. J. Biol. Biomed. Eng. 10, 168 – 175 [8] Høy M., et al., 2007. doi: 10.22358/jafs/74190/2007


 Looking for something specific?


