
An Introduction to Raman Spectroscopy
Intro
Raman spectroscopy, a molecular spectroscopy which is observed as inelastically scattered light, allows for the interrogation and identification of vibrational (phonon) states of molecules. As a result, Raman spectroscopy provides an invaluable analytical tool for molecular fingerprinting as well as monitoring changes in molecular bond structure (e.g. product formation; state changes and stresses & strains; crystalline form and crystallinity).
In comparison to other vibrational spectroscopy methods, such as FTIR and NIR, Raman has several major advantages. These advantages stem from the fact that the Raman effect manifests itself in the light scattered off of a sample as opposed to the light absorbed by a sample. As a result, Raman spectroscopy requires little to no sample preparation and is insensitive to aqueous absorption bands. This property of Raman facilitates the measurement of solids, liquids, and gases not only directly, but also through transparent containers such as glass, quartz, and plastic.
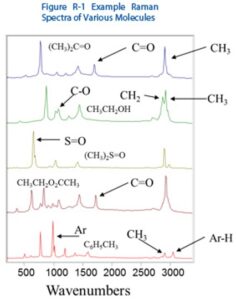
Raman spectroscopy is highly selective, as is the complementary method of FTIR , which allows it to identify and differentiate molecules and chemical species that are very similar, and measure small changes in samples. Figure R-1 shows an example of five molecules – Acetone, Ethanol, Dimethyl Sulfoxide, Ethyl Acetate, and Toluene, with peaks from specific functional groups marked. Although these organic solvents have similar molecular structure, their Raman spectra are clearly differentiable, even to the untrained eye. Using Raman spectral libraries, it is easy to see how easily Raman spectra can be used for material identification and verification.
Basic Function of Spectrometers
The basic function of any spectrometer is to take in light, break it into its spectral components, digitize the signal as a function of wavelength, and read it out and display it via a computer. In the first step of this process, light is directed through a fiber optic cable into the spectrometer through an entrance slit, which is a narrow aperture.
The slit vignettes the light as it enters the spectrometer. Then, in most spectrometers, the divergent light is collimated by a concave mirror and directed onto a grating. Following this, the grating disperses the spectral components of the light at slightly varying angles.
The light is then focused by a second concave mirror and imaged onto the detector. Alternatively, all of the three functions can be simultaneously performed using a concave holographic grating. There are various pros and cons to this alternative, which are discussed in the article titled, “An Introduction to a Spectrometer: Diffraction Grating”
Once the light is imaged onto the detector, the photons are converted into electrons. These electrons are digitized and read out through a USB (or serial port) to a computer.
Based on the number of pixels in the detector and the linear dispersion of the diffraction grating, the software interpolates the signal to generate a calibration that enables the data to be plotted as a function of wavelength over the given spectral range. This data can be subsequently used and manipulated for many spectroscopic applications.